Minerals are wealth. Mining is the sale of this wealth. The value of the mineral in the ground is the sale price minus the total costs of extracting the mineral, including a normal profit for the sub-contractor / extractor. Since mineral owners are selling their minerals, their goal must be to achieve zero loss. This is a fair situation as at zero loss, the extractor is earning a normal profit. We can define:
Loss = In-situ mineral value minus the consideration received in exchange for the mineral.
Loss Rate = Loss divided by In-situ mineral value.
There are many methods to calculate Loss and Loss Rates. This piece is an ongoing compendium of studies that have estimated or have enough data to calculate Loss & Loss Rates. If you know of others, please do contact us.
Note: There are some world estimates by the IMF and the World Bank that are linked below. Also, there are estimates from Bolivia, Namibia & Norway that result in negative losses, which is clearly unlikely over long periods – they have been included in the text below but not in the table. One estimate for Norway uses a completely different method to estimate a 50% loss rate since 2000. There are clear signs of losses in Canada and the US, but no good estimates so far.
| Location / Estimate | Mineral | Period | Estimated Loss Rate |
| Australia | All | 10 years (2000-2012) | 82% |
| Botswana | All | 36 years (1978-2014) | 7% |
| Burkina Faso | Gold | 5 years (2009-2013) | 67% |
| Canada | All | 23 years (1999-2022) | 75% |
| India – Goa – 2014 estimate | Iron Ore | 5 years (2004-2009) | 99% |
| India – Goa – 2015 estimate | Iron Ore | 8 years (2004-2012) | 95% |
| India – NMDC | Iron Ore | 10 years (2004-2014) | 92% |
| India – Sesa Goa / Vedanta | Iron Ore | 8 years (2004-2012) | 95% |
| India | Oil & Gas | 15 years (1990-2005) | 65% |
| Jordan | Phosphate | 9 years (2002-2010) | 48-87% |
| Jordan | Potash | 9 years (2002-2010) | 35-65% |
| Netherlands | Oil & Gas | 9 years (1990-1998) | 10% |
| Netherlands | Oil & Gas | 1 year (2017) | 21% |
| Peru – 2010 estimate | Many | 9 years (1998-2006) | 71% |
| Peru – 2012 estimate | Many | 9 years (2000-2008) | 78% |
| Philippines | Gold | 11 years (2002-2012) | 82% |
| Philippines | Copper | 11 years (2002-2012) | 84% |
| Philippines | Nickel | 11 years (2002-2012) | 79% |
| South Africa | Gold | 9 years (1966-1993) | 70% |
| South Africa | Coal | 9 years (1966-1993) | 96% |
| UK – 2014 estimate | Oil & Gas | 34 years (1979-2012) | 39% |
| UK – 2014 estimate | Oil & Gas | 36 years (1975-2010) | 35% |
World
1. The IMF, in its 2012 publication, Fiscal Regimes for Extractive Industries: Design and Implementation para 64, estimates mineral receipts are 65–85% of the value of the oil and 45–65% for minerals. In other words, loss rates of 15–35% for oil and 35–55% for minerals.[1]
2. Rents to Riches?: The Political Economy of Natural Resource-led Development by the World Bank reports that loss rates[2] are rarely lower than 10% for petroleum and 30% for solid minerals.[3]
3. The Changing Wealth of Nations study by the World Bank (2011) found that that since 1970, all countries in which rent from minerals accounted for more than 15% of GDP had negative Adjusted Net Savings.[4] In simple terms, they became poorer.
4. Where is the Wealth of Nations?, a 2005 study by the World Bank, found that had countries like Venezuela, Trinidad and Tobago, and Gabon saved their mineral wealth as required by the IE principle and Hartwick’s Rule[5], they would now be as rich as South Korea.[6]
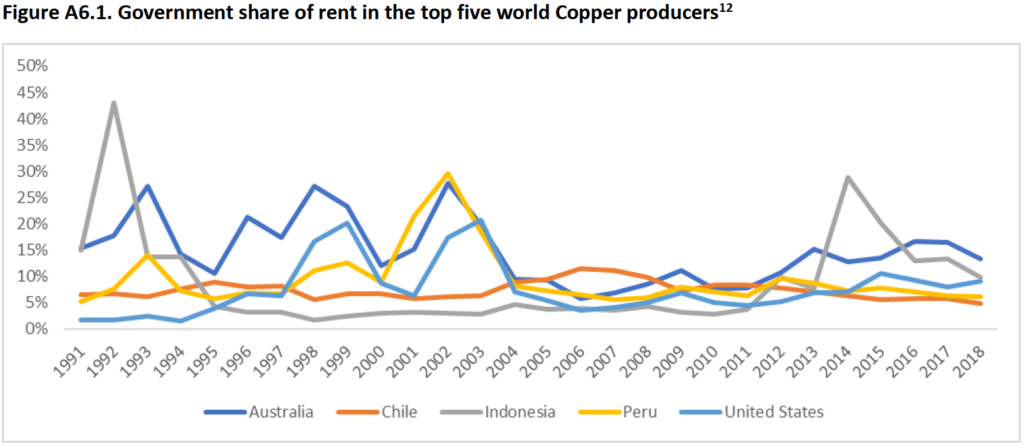
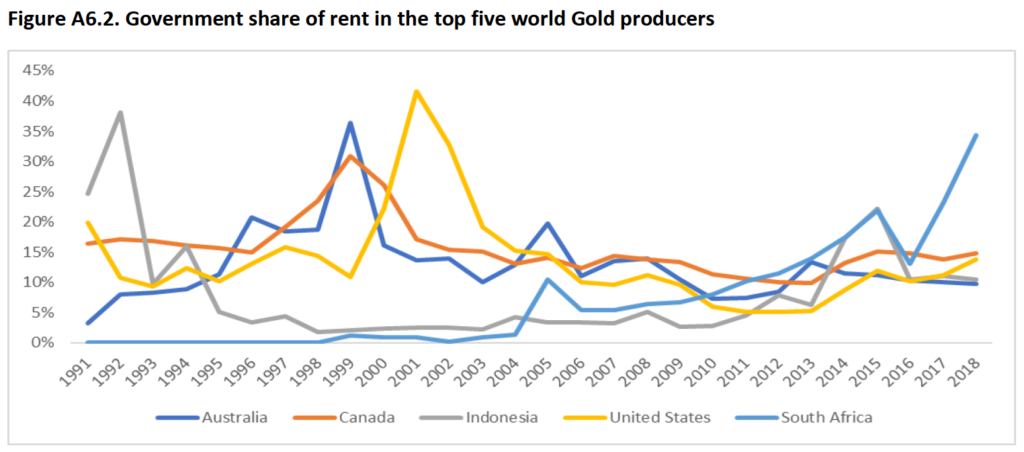
5. As part of The Changing Wealth of Nations 2021 by the World Bank, Appendix 6 on page 56 of the technical report Improving the estimates of mineral rent and asset value for the Changing Wealth of Nations 2021 by Lange, G.M., Wang X., Naikal, E. provides graphics for capture rates for the 5 largest national extractors of copper and gold. As can be seen, capture rates are well below 20% for the 2005-2012 period, implying loss rates in excess of 80%.
Australia
Source: Obst & Vardon, 2014. Recording environmental assets in the national accounts, as elaborated here
Minerals: All
Method for estimating Resource Rent: National Environmental-Ecological Statistics (SEEA based)
Period: 2000–2010 (ten years)
Resource Rent: AUD 266.2 billion. Consideration: AUD 47.4billion. Loss: AUD 218.8 billion
Loss Rate: 82%; Capture Rate: 18%
* Bolivia
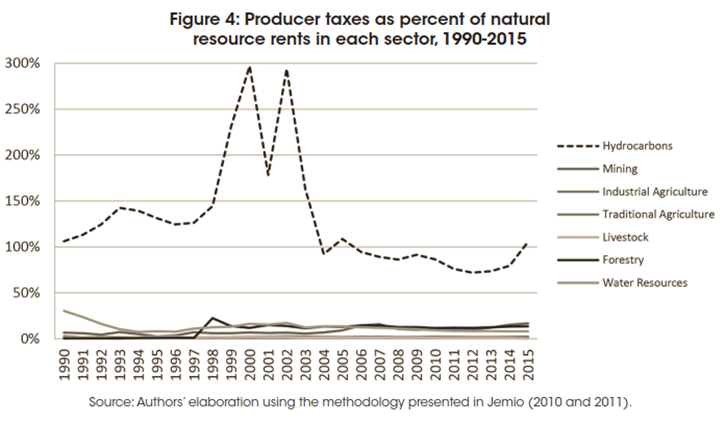
* Unlikely for “producer taxes” to so dramatically exceed natural resource rents for hydrocarbons
Source: Jemio, LC, et al, 2018. Bolivia’s Green National Accounts through a Commodity Super Cycle. See page 63
Botswana
Source: Jefferis, K. 2016. Mineral Revenues, Expenditure and Savings Policy in Botswana.
Minerals: All (Diamonds, Copper-Nickel, Coal, Gold, Soda Ash)
Method for estimating Resource Rent: SEEA
Period: 1978–2014
Resource Rent: BWP 206,637.5 million. Consideration: BWP 191,578.6 million. Loss: BWP 15,089.9 million.
Loss rate: 7%; Capture Rate: 93%

Burkina Faso
Source: Ouoba, Y., 2017. Economic sustainability of the gold mining industry in Burkina Faso, Table 3, page 198
Minerals: Gold
Method for estimating Resource Rent: Hotelling Rent, following Vincent (2007)
Period: 2009–2013
Resource Rent: CFA 1,207.97 billion. Consideration: CFA 399.81 billion. Loss: CFA 805.43 billion
Loss Rate: 67%; Capture Rate: 33%
Canada
Since 2015, Statistics Canada has been providing quarterly data on the NPV of future losses. The weighted average up to Q1 2023 is 75% (although such an average has significant issues). Median is 73%, maximum is 86% and minimum is 44%.
Some articles that indicate the presence of losses
Wilt, J., 2019. Internal memo at Natural Resources Canada responds to The Narwhal’s reporting on low mining taxes and royalties. The Narwhal
Wilt, J., 2018. Are Albertans collecting a fair share of oilsands wealth? The Narwhal
Wilt, J., 2018. Canada’s mining giants pay billions less in taxes in Canada than abroad. The Narwhal
India
Iron Ore — Goa — 2014
Source: Basu, R., 2014. Implementing Intergenerational Equity in Goa. Economic & Political Weekly, Vol XLIX No 51, Table 2, page 35
Method for estimating Resource Rent: World Bank Adjusted Net Savings series
Period: 2004–2009 (5 years)
Resource Rent: Rs. 48,199 crore. Consideration: Rs. 161 crore. Loss: Rs. 48,038 crore
Loss Rate: 99.7%; Capture Rate: 0.3%
Iron Ore — Goa — 2014
Source: Basu, R., 2015. Catastrophic failure of public trust in mining: Case study of Goa. Economic & Political Weekly, Vol L No 38, Table 2, page 48
Method for estimating Resource Rent: Annual report, sale price minus expenses minus return on capital. Scaled up by volume exported.
Period: 2004–2012 (8 years)
Resource Rent: Rs. 51,655 crore. Consideration: Rs. 2,387 crore. Loss: Rs. 49,268 crore
Loss Rate: 95%; Capture Rate: 5%
Iron Ore — NMDC Ltd
Source: Basu, R., 2015. Catastrophic failure of public trust in mining: Case study of Goa. Economic & Political Weekly, Vol L No 38, Table 2, page 47
Method for estimating Resource Rent: Annual report, sale price minus expenses minus return on capital.
Period: 2004–2014 (10 years)
Resource Rent: Rs. 56,671 crore. Consideration: Rs. 4,503 crore. Loss: Rs. 52,248 crore
Loss Rate: 92%; Capture Rate: 8% (Note in a few mines, part of the value is captured by states as owners through JVs, but even then, the average capture rate would be 67%, implying a loss rate of 33%)
Iron Ore — Sesa Goa / Vedanta Ltd
Source: Basu, R., 2015. Catastrophic failure of public trust in mining: Case study of Goa. Economic & Political Weekly, Vol L No 38, Table 2, page 47
Method for estimating Resource Rent: Annual report, sale price minus expenses minus return on capital.
Period: 2004–2012 (8 years)
Resource Rent: Rs. 18,794 crore. Consideration: Rs. 889 crore. Loss: Rs. 17,905 crore
Loss Rate: 95%; Capture Rate: 5%
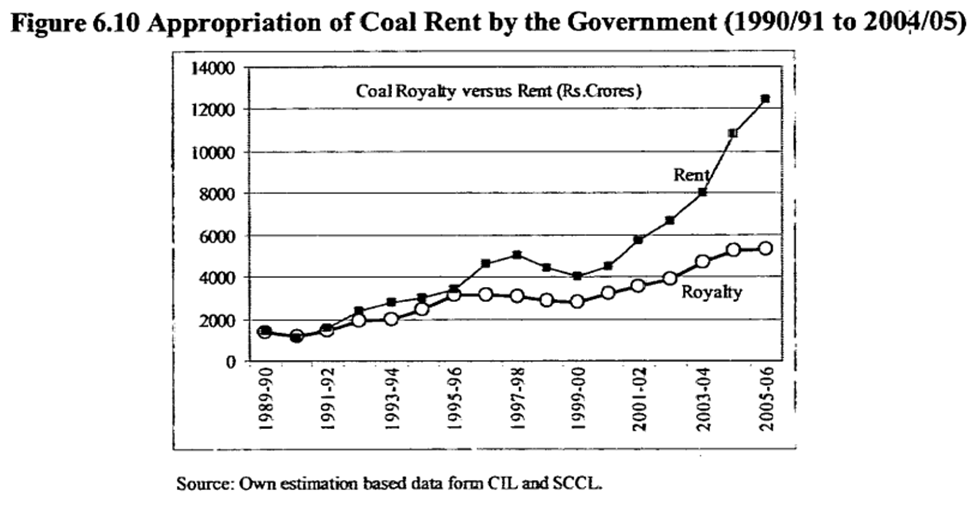
India — Coal, Oil & Natural Gas
Source: Saksena, Shalini (2009). Sustainable Resource Accounting — A Case Study of the Fossil Fuels SectorTable 6.15, PhD thesis, Jawaharlal Nehru University, New Delhi
Minerals: Coal, Oil & natural gas
Method for estimating Resource Rent: Annual report, sale price minus expenses minus return on capital.
Oil & natural gas
Period: 1990–2005 (15 years). Entirely national owned companies. However, onshore oil & gas owned by states, not national government. Significant oil & gas was offshore (owned by national government).
Loss Rate: 65%; Capture Rate: 35%
Resource Rent: Rs. 124,292 crore. Consideration: Rs. 44,025 crore. Loss: Rs. 80,266 crore
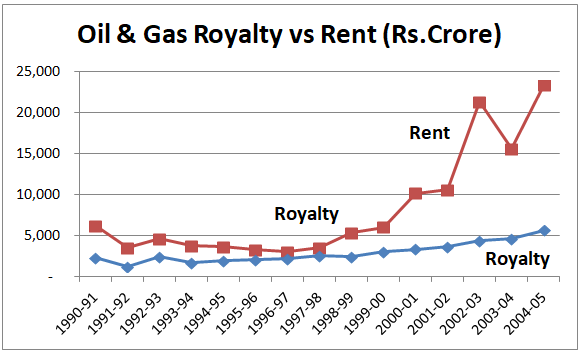
Coal
Period: 1989–2006 (17 years)
Cannot be determined, only graph available. Beginning of period, Loss Rate was close to zero. By the end of period, when prices and rents soared, Loss Rate had clearly exceeded 50%.
Resource Rent: Rs. 81,826 crore. Cannot be determined, only graph available
Jordan
Source: Alrawashdeh, R., Al-Tarawneh, K., 2014. Sustainability of phosphate and potash reserves in Jordan, page 59.
Period: 2002–2010 (nine years)
Phosphates: Loss rates from 48% upto 76–87%.
Potash: Loss rates less than 65%, best of 35% in 2008
“To appreciate the magnitude of the resource rent in comparison to the institutional royalties and taxes collected by the government, data from JPMC and APC reports, showed that the percentage of the royalties and taxes over the resource rent for phosphate resources was around 52% in 2002 and declined to 13% in 2008 and 14% in 2010 … Also, the percentage of the royalties and taxes over the resource rent for potash was almost above 35% for all years. It reached to around 42% in 2002, 45% in 2008 and 40% in 2010”
* Namibia
* The proper rate of normal profit was not estimated, instead 10% and 20% were used.
Estimate in 2003
Source: Lange, Glenn-Marie, 2003. The contribution of minerals to sustainable economic development: Mineral resource accounts in Namibia, Directorate of Environmental Affairs, Ministry of Environment and Tourism, Government of Namibia
Minerals: All
Method for estimating Resource Rent: Macro-economic / National Accounts.
Period: 1980-2001 (22 years)
Resource Rent @10% rate of normal profit: Namibian $ 6,232 million. Consideration: Namibian $ 3,358 million. Loss: Namibian $ 2,874 million
Loss Rate: 46%; Capture Rate: 54%
Note: Alternative version where a 20% rate of normal profit was assumed ends up with highly unlikely results.
Resource Rent @20% rate of normal profit: Namibian $ 116 million. Consideration: Namibian $ 3,358 million. Loss: Namibian $ -3,242 million (extractors are receiving less than 20% return on assets)
Loss Rate: -2794%; Capture Rate: 2894% (over a 16 year period, an absurd result)
Estimate in 1997
Source: Lange, Glenn-Marie & Motinga, Daniel J., 1997. The Contribution of Resource Rents from Minerals and Fisheries to Sustainable Economic Development in Namibia, Directorate of Environmental Affairs, Ministry of Environment and Tourism, Government of Namibia
Minerals: All
Method for estimating Resource Rent: Macro-economic / National Accounts. The proper rate of normal profit was not estimated, instead 10% and 20% were used.
Period: 1980-1995 (16 years)
Resource Rent @10% rate of normal profit: Namibian $ 4,010 million. Consideration: Namibian $ 3,226 million. Loss: Namibian $ 784 million
Loss Rate: 20%; Capture Rate: 80%
Note: Alternative version where a 20% rate of normal profit was assumed ends up with highly unlikely results.
Resource Rent @20% rate of normal profit: Namibian $ 1,131 million. Consideration: Namibian $ 3,226 million. Loss: Namibian $ -2,095 million (extractors are receiving less than 20% return on assets)
Loss Rate: -185%; Capture Rate: 285% (over a 16 year period, an absurd result)
Netherlands
Estimate in 2000
Source: Todsen, S., Gie, G., 2000. Accounts for subsoil assets — Results of pilot studies in European countries. Eurostat Task Force on Subsoil Assets, Section 6.4 on page 41 and also Section 5.2
Minerals: Oil & Gas
Method for estimating Resource Rent: Macro-economic / National Accounts
Period: 1990-1998 (9 years)
Resource Rent: ECU 39,396 million. Consideration: ECU 35,496 million. Loss: ECU 3,901 million.
Loss Rate: 10%; Capture Rate: 90%
Estimate in 2020
Source: van de Ven, P., de Haan, M., 2020. Accounting for Economic Ownership and Depletion of Natural Resources. 14th Meeting of the Advisory Expert Group on National Accounts, Agenda item 6.2.
Minerals: Oil & Gas
Method for estimating Resource Rent: Macro-economic / National Accounts
Period: 2017 (one year)
Resource Rent: € 3,641 million. Consideration: € 2,876 million. Loss: € 765 million
Loss Rate: 21%; Capture Rate: 79%
* Norway
One estimate using official government and national income statistics results in negative losses / loss rates over 46 years, which is quite absurd. The study by Knut Anton Mork uses a method that is not comparable with the other studies here.
Estimate in 2019
Sources: 1) 2020. The net government cash flow from petroleum activities, 1971-2019. Statistics Norway
2) Liu, G., 2016. The wealth of Norwegian raw oil and natural gas. Statistics Norway
Method for estimating Resource Rent: Macro-economic / National Accounts
Period: 1970-2015 (46 years)
Resource Rent: NOK 4,745 billion. Consideration: NOK 6,889 billion. Loss: NOK -2,144 billion.
Loss Rate: -45%; Capture Rate: 145%
Estimate in 2020
Source: Mork, K.A., 2020. The Long Norwegian Boom: Dutch Disease after all? Department of Economics,
Norwegian University of Science and Technology, Working Paper
Minerals: Oil & Gas
Method for estimating both Resource Rent and loss is a very indirect macro-economic technique.
Abstract: The Norwegian non-oil economy has benefitted greatly from the presence of the oil sector. Compared to neighboring and otherwise similar Sweden, Norwegian non-oil (“mainland”)firms on average receive significantly higher product prices and pay higher wages. This development can be explained by a model where oil companies drive up the prices of domestic suppliers as they consider foreign suppliers imperfect and inferior substitutes.
Although productivity also improved, the resulting increased prosperity is mainly the result of higher prices and wages. Despite a tax system designed to channel the entire resource rent into the sovereign wealth fund, more than half of the resource rent may have leaked to the private, non-oil economy because of the mechanisms studied here. Because the bonanza
must end with the oil industry, important productivity gains have not saved Norway from
the Dutch disease.
Peru
Population: 32.2 million (2017)
Estimate in 2010
Source: E. Figueroa B., et al., 2010. Green accounting and sustainability of the Peruvian metal mining sector.
Minerals: Multiple
Method for estimating Resource Rent: Macro-economic / National Accounts
Period: 1998–2006
Resource Rent: US$ 33,970 million. Consideration: US$ 9,992 million. Loss: US$ 23,978 million
Loss Rate: 71%; Capture Rate: 29%
Estimate in 2012
Source: Cantuarias-villessuzanne, C., 2012. La Mesure économique de la Dépréciation du Capital Minier au Pérou (Thèse de doctorat) page 159. Bordeaux IV.
Minerals: Multiple
Method for estimating Resource Rent: Micro-economic
Period: 2000–2008, Units: 2006 USD million
Resource Rent: US$ 52,543,267. Consideration: US$ 11,739,119. Loss: US$ 40,714,148
Loss Rate: 77.62%; Capture Rate: 22.38% (wrongly written as 16.7%)
Philippines
Population: 116.8 million (2025)
Source: Magno, C., & Guzman, R. R. S. (2019). Evaluating the Large-Scale Mining Fiscal Regime in the Philippines. Philippine Political Science Journal, 40(1-2), 32-68. https://doi.org/10.1163/2165025X-12340002
Minerals: Multiple
Method for estimating Resource Rent: EITI data, “residual value method using gross production data from government“
Period: 2002-2012
| Mineral | Rent as % of Production Value | Loss Rate | ||
| Average | High | Low | ||
| Gold | 36.1% | 82.1% | 89.2% | 71.0% |
| Copper | 50.5% | 83.8% | 90.6% | 75.5% |
| Nickel | 72.1% | 78.4% | 90.0% | 61.5% |
| Combined | 51.1% | 80.9% |
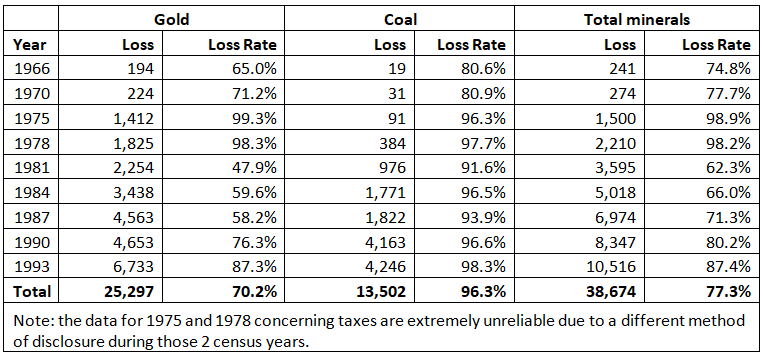
South Africa
Source: Blignaut, J.N., Hassan, R.M., Assessment of the performance and sustainability of mining sub-soil assets for economic development in South Africa. Page 96
Minerals: Gold, Coal
Period: 1966–1993 (Nine years total. Not all years available.)
Gold: Resource Rent: SAR 36,017 million. Consideration: SAR 10,720 million. Loss: SAR 25,297 million.
Coal: Resource Rent: SAR 14,018 million. Consideration: SAR 516 million. Loss: SAR 13,502 million.
Loss rates: Gold varies from 47.9% to 99.3%. Coal varies from 80.6% to 98.3%.
UK
Estimate in 2014
Source: Myers, K., 2014. National Hydrocarbon Accounting: a methodology for monitoring upstream sector governance. RWI-NRC Discussion Paper, page 21
Minerals: North Sea Oil
Method for estimating Resource Rent: Macro-economic / National Accounts
Period: 1979–2012
Resource Rent: GBP 297,781 million. Consideration: GBP 182,955 million. Loss: GBP 114,826 million.
Loss Rate: 39%; Capture Rate: 61%
Estimate in 2016
Source: Atkinson & Hamilton, 2016. Asset accounting, fiscal policy and UK’s oil and gas
Minerals: North Sea Oil
Method for estimating Resource Rent: Macro-economic / National Accounts
Period: 1975–2010
Resource Rent: GBP 436 billion. Consideration: GBP 284 billion. Loss: GBP 152 billion
Loss Rate: 35%; Capture Rate: 65%
* USA
Some articles that indicate the presence of losses
Gara, Les., 2019. A fair share for our oil will help fix Alaska’s deficit
[1] Fiscal Regimes for Extractive Industries: Design and Implementation, para 64
[2] The study quotes government take / average effective tax rates. It can be shown that under normal circumstances, the capture rate is lower than the government take. See Basu, R. (2015). Catastrophic Failure of Public Trust in Mining: Case Study of Goa. Economic and Political Weekly L(38), 44–51
[3] Barma, N., Kaiser, K., and Le, T. (2011). Rents to Riches?: The Political Economy of Natural Resource-LedDevelopment. The World Bank Group. Annex 4.2 and 4.3.
[4] The Changing Wealth of Nations. (2011). Washington, D.C.: World Bank. Page 11.
[5] “The Hartwick rule holds that consumption can be maintained — the definition of sustainable development — if the rents from nonrenewable resources are continuously invested rather than used for consumption.” Hamilton, K. (2006). Where is the Wealth of Nations?. Washington, D.C.: World Bank. Page 9.
[6] Hamilton, K. (2006). Where is the Wealth of Nations?. Washington, D.C.: World Bank. Page 54.
Rahul Basu is the Research Director of Goa Foundation, an environmental NGO in India. This work is based on the practical work of the Goa Foundation.